
Working Capital Management
Objectives of Working Capital Management
Working capital management entails monitoring and managing a company’s current assets and current liabilities to ensure sufficient liquidity for daily operations which, in turn, guarantees profitability.
A business with inadequate working capital will be unable to meet obligations as the fall due, resulting in late payment to suppliers, employees, and other creditors. In addition, late payments may result in loss of supplier discounts, loss of employee loyalty, and damaged credit rating, and ultimately can lead to a mandatory liquidation of assets to repay creditors.
- Working Capital = Current Assets – Current Liabilities
- Working Capital Ratio = Current Assets / Current Liabilities
A positive working capital indicates a company has more current assets than current liabilities, implying it can meet its short-term obligations. A negative working capital signifies liabilities exceed assets, which could signal potential liquidity difficulties.
A ratio between 1.2 and 2.0 is generally deemed healthy, suggesting a good balance between assets and liabilities.
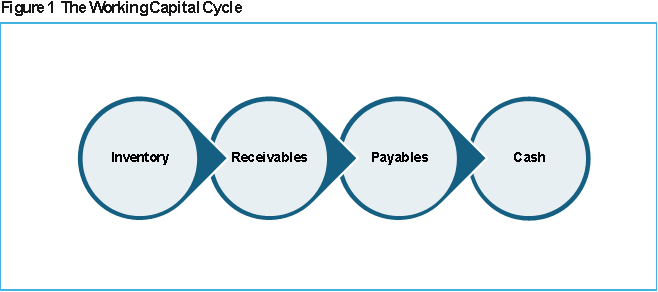
- Inventory: Finished goods, work in progress, raw materials.
- Receivables: Also known as debtors, cash expected to be received from after inventories have been sold.
- Payables: Purchases on credit (short-term debts payable, usually within one year).
- Cash: Cash is immediately available as funds to pay creditors or to make investments.
Trade-off Between Liquidity and Profitability:
- High Liquidity, Lower ProfitabilityWhen a firm holds a large amount of cash or highly liquid assets, it is very secure and less likely to encounter financial difficulty. However, cash itself does not generate significant returns, and holding too many idle liquid assets signifies missing out on potentially higher profits from less liquid, but more profitable, long-term investments.
- High Profitability, Lower LiquidityTo maximize profits, firms often invest in long-term assets like property, plant, and equipment, which can generate higher returns. However, these assets are less convertible into cash, reducing firm’s overall liquidity. If a firm relies too heavily on these assets, it could struggle to meet unexpected short-term expenses, risking financial problem.
Finding the Balance Between Liquidity and Profitability:
- Working Capital Management
Effective working capital management is crucial for striking the right balance between liquidity and profitability.
- Strategic Decision-Making
Finance managers must carefully consider the risks and rewards of each approach to ensure the company can both operate smoothly and grow its profits.
Nonlinear Relationship
Research suggests the relationship isn’t always a straight inverse line; some level of liquidity can actually improve profitability, but beyond a certain point, holding more liquid assets starts to diminish profits.
Liquidity Ratio
- Current ratio = Current assets / Current liabilities
If the current ratio is below 1 this may imply difficulties in meeting obligations as they fall due, even as current ratio is above 1 it may not guarantee liquidity, specifically if inventory is slowing moving. On the other hand, a very high current ratio is not advisable as it may suggest ineffective use of resources.
- Quick (acid test) ratio = Quick / Current liabilities = Current assets – inventory / Current liabilities
The quick ratio is specifically significant where inventory is slowing moving.
Efficiency Ratios
- Inventory Turnover = Cost of Sales / Average Cost of Sales
This indicates how quickly inventory is sold. A higher turnover suggests faster-moving inventory.
- Inventory Days = (Average Inventory / Annual Cost Sales) x 365
Inventory days, also known as days in inventory (DSI), is a financial ratio that measures how long it takes a company to sell its inventory. It significantly suggests how efficiently a company to sell its inventory. It significantly suggests how efficiently a company is managing its managing its inventory indicates better inventory management and faster sales turnover, while a higher value may suggest problems with demand, pricing, or inventory management.
- Trade Receivables Days = (Average Trade Receivables / Annual Credit Sales) x 365
Trade receivables days, also known as debtor days, is financially metric that suggests the average time it takes for a company to collect payment after a deal of sale on credit. A lower figure of trade receivables days generally suggests better cash flow management, while a higher figure indicates better potential difficulties with collection.
- Trade Payables Days = (Average Trade Payables / Annual Credit Purchases) x 365
Trade payables days, also known as Days Payables Outstanding (DPO), measures how long it takes a company to pay its suppliers. It is a key metric for evaluating a company’s working capital management and its relationship with suppliers. A higher figure of trade payables days usually indicates that a company is taking longer to pay its bills, which can be advantageous for cash flow management, but may as well affect supplier relationship.
Working Capital Analysis