Cost Accounting
Cost Drivers and Cost Management
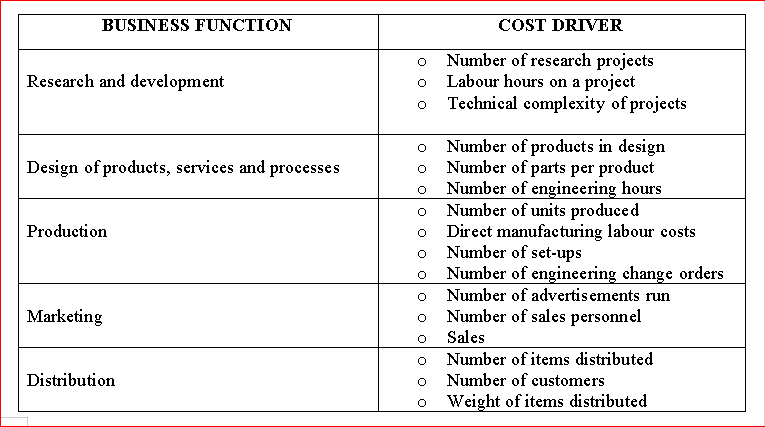
Cost Drivers
Cost drivers are factors that cause a change in the cost of an activity. They can be broadly categorised into volume-based and activity-based drivers, with further categorisations, such as transaction and duration drivers.
Volume-Based Cost Drivers
These cost drivers are related to the quantity or size of output, example units of produced, hours worked, or sales carried out.
- Direct Labour Hours:The amount of time an employee spends on production.
- Machine Hours: The amount of time machines is used in production.
- Number of Units Produced:The total quantity of products manufactured.
Activity-Based Cost Drivers
These are costs based on the processes that consume resources, example for machine setups, inspections, or deliveries, such as:
- Number of Setups:The frequency of changing production equipment or materials for various batches.
- Number of Inspections:The difficulty of making sure the quality of products or processes.
- Number of Customer Inquiries:The number of customer service calls or emails received.
Cost Drivers
Unit Costs
The unit cost also known as average cost is s specific unit of product, service, time, activity, or combination used to quantify and track costs. Unit cost is the basic unit for which costs are computed and allocated.
- Formula for calculating Unit cost: Total costs / Number of units = cost per unit
Marginal Cost (MC)
A marginal cost is the change in total production cost (incremental cost) that arises from making one additional unit of a good or service. The MC basically focuses on variable costs, which change with production volume, such as labour and raw materials.
- Formula for calculating marginal cost (MC): MC = (change in Total Cost) / (Change in Quantity).
Variable Cost (VC)
A variable is an expense that varies in direct proportion to the level of business activity, such as production volume or sales. The more a company produces or sells, the higher its variable cost, hence it is directly tied to output.
- Formula for calculating variable cost: Total Variable Cost = (Variable Cost per Unit) / (Total Units produced)
Direct Costs
Direct costs are expenses that can be directly traced and attributed to a particular product, service or project. These costs are directly linked to the production process and vary with the level of output.
Indirect Costs
Indirect costs, also known as overhead costs, constitute the expenses that a business incurs that not directly linked to the production of a particular good or service. There are crucial for overall business operations and bolster the production process, but they cannot be easily traced to individual products or services.
Prime Costs
Prime costs are company’s expenses directly related to the materials and labour used in production. The prime cost computes the direct costs of raw materials and labour that are involved in the production of goods or services. Prime costs do not include indirect costs.
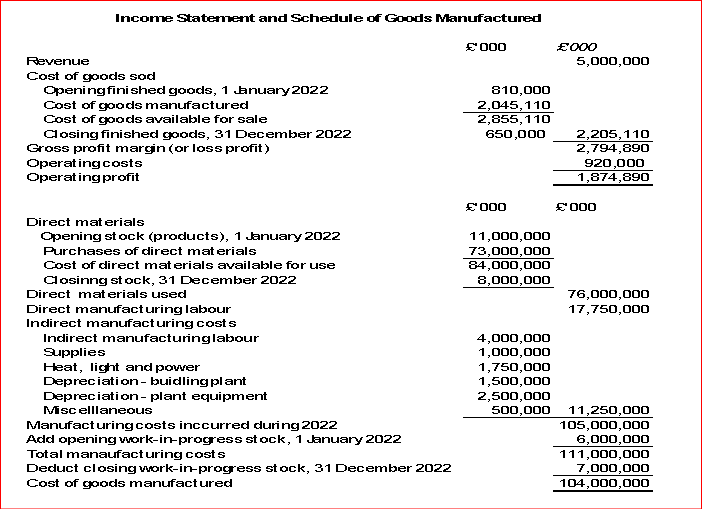
Conversion Costs
Conversion costs are referred to as the expenses incurred in transforming raw materials into finished goods, particularly including direct labour and manufacturing overhead. Essentially, it is the cost of converting raw materials into a finished product.
- Opening finished goods stock + Cost of goods manufactured – Closing finished goods stock = Cost of goods
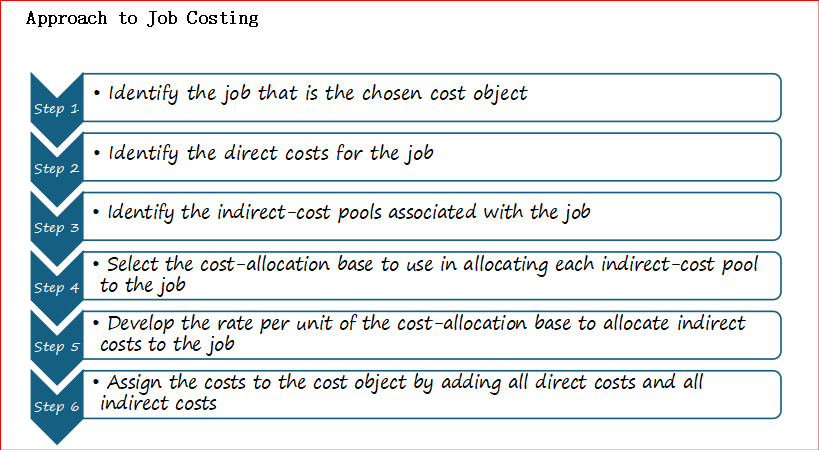
- Job Costing System
Cost Object
A cost object is referred to as anything to which costs are assigned for purpose of measuring and analysing their value. It is a primary concept in cost accounting and allows businesses to rack and manage expenses associated with specific products, services, projects, or other business operations. There are direct costs of a cost object (that can be traced to cost object in an economically feasible way, and indirect costs of a cost object (that cannot be traced to cost object in an economically feasible way).
Cost Pool
A cost pool is an accounting measure of grouping individual costs that are associated with a specific activity, product, or service, related to an organization. A cost pool is a way to organize and allocate expenses, ensuring tracking and managing of costs easier.
Cost pools are usually linked to cost drivers, which are factors that effect costs to change. Common examples of cost pool are:
- Manufacturing:A cost pool for “machining” could include costs for machine depreciation, maintenance, and related labour.
- Customer Service:A cost pool for “customer service” might include salaries of customer service representatives, software costs, and phone expenses.
- Marketing:A cost pool for “advertising” might include costs for online advertisements, print advertisements, and promotional materials.
Cost pools are often linked to cost drivers, which are factors that cause costs to change. For example, the number of machine hours might be a cost driver for the maintenance cost pool.
Cost-allocation Base
Cost allocation base is a measure used to distribute indirect costs, also known as overhead costs, to cost objects, such as products and services. It serves as the denominator in a cost allocation calculation which helps to determine how much of the indirect costs should be assigned to each cost object, based on the on its consumption of resources.
- Allocation Rate = Total Cost Pool / Total Allocation Base
Common Cost-Allocation Bases:
- Direct Labor Hours:The number of hours spent by employees working directly on a product or service.
- Direct Labor Cost:The total cost of labour directly involved in production.
- Machine Hours:The number of hours that machines are used in production.
- Units of Product:The number of individual units produced.
- Square Footage:The amount of space occupied by a department or product.
- Formula for Actual Direct Rate: Actual total costs in direct-cost pool / Actual total quantity of cost-allocation base.
Actual direct-cost rate = £45,000 + £22,000 + £15,000 / 2,000 = £41 per professional labour-hour
- Formula for Actual Indirect Rate: Actual total quantity of indirect-cost pool / Actual total quantity of cost-allocation base.
Under-allocated Indirect Costs
The under-allocated indirect costs occur when the allocated amount of indirect costs in an accounting period is less than the actual (incurred) amount in that period.
Over-allocated Indirect costs
The over-allocated indirect costs occur when the allocated amount of indirect costs in an accounting period exceeds the actual (incurred) amount in that period.
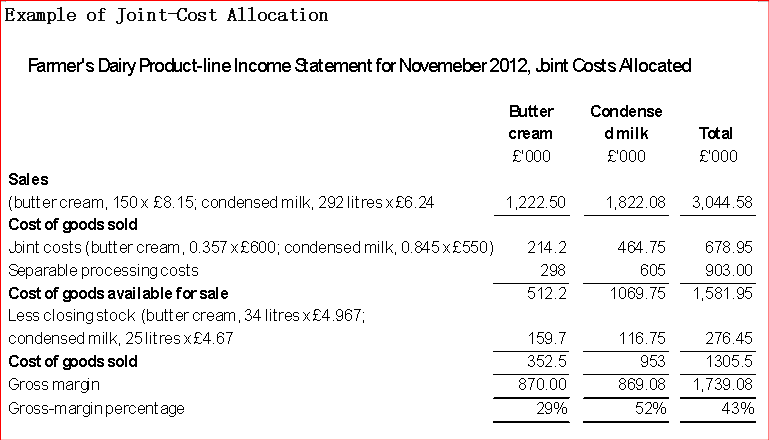
Joint-Cost Allocation
Joint cost allocation is the process of assigning collective costs incurred in producing multiple products or services from the same input to each individual product or service. This is done to ascertain the cost of each product or service, and to make informed decisions regarding pricing, profitability, allocation of resources.
Under-allocated Indirect Costs
The under-allocated indirect costs occur when the allocated amount of indirect costs in an accounting period is less than the actual (incurred) amount in that period.
Over-allocated Indirect costs
The over-allocated indirect costs occur when the allocated amount of indirect costs in an accounting period exceeds the actual (incurred) amount in that period.
Joint-Cost Allocation
Joint cost allocation is the process of assigning collective costs incurred in producing multiple products or services from the same input to each individual product or service. This is done to ascertain the cost of each product or service, and to make informed decisions regarding pricing, profitability, allocation of resources.
Example of Joint-Cost Allocation
- Cost-Volume-Profit (CVP)
The cost-volume profit examines the behaviour of total revenues, total costs, and operating profit as changes happen in the output level, selling price, variable profit, or fixed costs.
Cost-volume-profit (CVP) analysis, also known as break-even analysis, is an approach used by businesses to comprehend how changes in costs and sales volume affect profitability. The breakeven point is that quantity of output where total revenues and total costs are equal.
Breakeven Equation
- Operating profit = Revenues – Variable costs – Fixed costs
- Operating profit = (unit selling price x Quantity of output units sold or manufactured) – (Unit variable costs x Quantity units sold or manufactured) – Fixed costs.
- Contribution margin = Revenue – all costs of output (product or service)
- Breakeven number of units = Fixed costs / unit contribution margin
- Income tax effects on target net profit:
- Target net profit = (Operating profit) – [(Operating profit) x (Tax rate)]
- Target net profit = (Operating profit) x (1-Tax rate)
- Operating profit = Target net profit / (1-Tax rate)
Revenue and Cost Drivers
Revenue and cost drivers are factors that influence a company’s revenue and expenses. Identifying these drivers is crucial for understanding a business’s financial performance and making informed decisions. Revenue drivers increase income, while cost drivers increase expenses, that is, where the operating profit is zero.
Revenue Drivers Examples:
- Number of Customers:The more customers a business serves, the higher the potential revenue.
- Sales Volume:Selling more products or services leads to increased revenue.
- Pricing:Increasing the price of products or services can boost revenue, but it may also affect sales volume.
- Product Mix:Selling a higher proportion of high-margin products can increase overall revenue.
- Customer Acquisition Cost:Reducing the cost to acquire new customers can improve revenue and profitability.
- Market Share:Increasing market share can lead to higher sales and revenue.
Cost Drivers Examples:
- Direct Materials:The cost of raw materials used in production.
- Direct Labor:The wages paid to workers directly involved in production.
- Machine Hours:The time a machine is used in production, impacting energy and maintenance costs.
- Number of Employees:The more employees a company has, the higher the labour costs.
- Utilities:Costs related to electricity, gas, and water.
- Rent:Costs associated with leasing or renting facilities.
- Marketing Expenses:Costs related to advertising and promotional activities.
- Research and Development:Investments in innovation and new product development.
- Transportation Costs:Costs associated with shipping and delivery.
- Maintenance Costs:Costs associated with maintaining equipment and facilities.
- Quality Control Costs:Costs associated with ensuring product quality.
Cost-Volume Profit Example:
Bonaviaje SA retails two products, a standard and a deluxe version of a luggage carrier. The budgeted income statement is as follows:
- Calculate the breakeven point in units, assuming that the planned revenue mix is maintained.
- Calculate the breakeven point in units (i) if only standard carriers are sold, and (ii) if only deluxe carriers are sold.
- Suppose 200,000 units are sold, but only 20,000 are deluxe. Calculate the operating profit. Calculate the breakeven point if these relationships persist in the next period. Compute your answers with the original plans the answer in requirement (a).
Answers:
(a) Let Q = Number of units of deluxe product to break even.
3Q = Number of units of standard product to break even.
Revenues – Variable costs – Fixed costs = Zero operating profit.
£20(3Q) + £30Q – £14(3Q) – £18Q – £1,200,000 = 0
£60Q + £30Q – £42Q – £18Q = £1,200,000
£30Q = £1,200,000
Q = 40,000 units of deluxe
3Q = 120,000 units of standard
The breakeven point is 120,000 standard units plus 40,000 deluxe carriers, a total of 160,000 units.
(b) Unit contribution margins are: standard: £20 – £14 = £6; deluxe: £30 – £18 = £12.
- If only standard carriers were sold, the breakeven point would be:
£1,200,000 /£6 = 200,000 units
- If only deluxe carriers were sold, the breakeven point would be:
£1,200,000 / £12 = 100,000 units
(C.) Operating profit = 180,000 (£6) + 20,000(£12) – £1,200,000
= £1,080,000 + £240,000 – £1,200,000
= £120, 000
Let Q = Number of units of deluxe product to break even.
9Q = Number of units of standard product to break even.
£20(9Q) + £30Q – £14(9Q) – £18Q – £1,200,000 = 0
£180Q + £30Q – £126Q – £18Q = £1,200,000
Q = 18,182 units of deluxe
9Q = 163, 638 units of standard
The breakeven point is 163,638 standards + 18,182 deluxe, total of 181,820 units.
The lesson of this problem is that changes in sales mix change breakeven points and operating profits. In this example, the budgeted and actual total sales in number of units were identical, but the proportion of the product having the higher contribution margin decreased. Operating profit suffered, declining from £300,000 to £120,000. Also, the breakeven point increased from 160,000 to 181,820 units.
- Activity Based Costing (ABC)
Activity-Based Costing is an accounting method that identifies (the cost pool and cost drivers) activities within an organization and allocates the cost of each activity to all products and services based on their actual consumption. It is a more detailed method than traditional costing, as it focuses on accurately allocating both direct and indirect costs, specifically overhead, to specific products and services.
Cost Smoothing
Cost smoothing is referred to as a strategy that aims to reduce or eliminate changes in costs, expenses, or prices over time, resulting in a more stable or predictable approach. The includes spreading out costs, moderating price fluctuations, and adjusting accounting practices to attain smoother financial outcomes.
Product Undercosting
A product under-costing happens when a cost of production consumes a relatively high level of resources but is reported to have a relatively low total cost.
Product Overcosting
A product over-costing happens when a cost of production consumes a relatively low level of resources but is reported to have a relatively high total cost.
ABC Indirect Cost Pool System
- Step 1: Identify the chosen cost objects. The cost objects are the 65,000 Gucci Glasses, and the 12,000 Ray Ban Glasses.
- Step 2: Identify the direct costs of the products
Step 3: Select the cost-allocation bases to use for allocating indirect costs to the products.
Step 4: Identify the indirect costs associated with each cost-allocation base
Step 5: Calculate the rate per unit of each cost-allocation base used to allocate indirect cost to the products
Actual indirect-cost rate = Actual total costs in indirect-cost pool / Actual total cost quantity of cost-allocation base
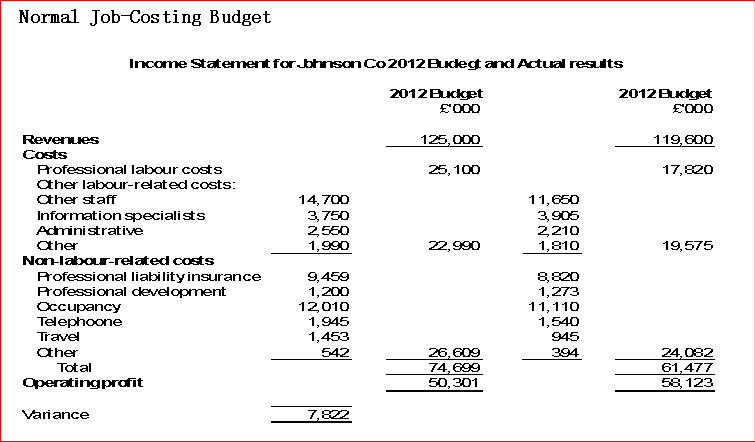
Budgets and Responsibility Accounting
Budgets
Budgets are one of the most extensively used tools for planning and controlling organizations. Budgeting systems turn managers’ perspective forward. A forward-looking perspective helps managers to be in a better position to capitalize on opportunities. In addition, budgets enable managers to anticipate risks and take steps to reduce or eliminate them.
Budgets can compute the planned financial effects of activities focused on continuing improvement, and cost reduction, including assessing the performance of managers or the business areas.
Numerous organizations adopt the following budget cycle:
- Planning the performance of the organization as well as its subunits, and the entire management team consents upon what is expected.
- Providing a point of reference, a set of specific or tailored expectations against which actual results can be contrasted.
- Examining variations from plans. If essential, corrective measure follows examination.
- Planning again, reviewing feedback and altered conditions.
Roles of Budgets
Budgets are a principal characteristic of management control systems. Current thinking regarding budgetary control systems postulates two opposite views. The first view that supports incremental improvements to budgetary procedures, in terms of associating such procedures more closely to operational requirements and planning systems and upscaling the frequency of budget revisions and the execution of rolling budgets. The second view advocates the desertion of budgetary control and its replacement with optional techniques to ensure organizations become more adaptive and agile.
Strategy and Plans
Budgeting is most significant when done as an integral aspect of organization’s strategic analysis. Strategy can be viewed as expressing how an organization matches its own capabilities with the opportunities in the marketplace to achieve its overall goals.
Strategic analysis outlines both long-term and short-term planning. Subsequently, these plans result in the formation of budgets. Budgets give feedback to managers about the possible impacts of their strategic plans.
Coordination and Communication
Coordination is the harmonizing and balancing of all characteristics of production or service and all the departments and business functions so that organization can meet its goals. Communication is getting those goals understood and consented by all departments and functions.
Types of Budgets
- Rolling Budget
Rolling budget is referred to as a financial planning method where the budget is continually revised and updated by adding a new future period (month and quarter) as the current period ends, while dropping the earliest period. This brings about a budget that often looks ahead by a fixed length of time, providing more flexibility and responsiveness to fluctuating circumstances benchmarked with traditional budgets.
- Operating Budget
Operating budget is a financial plan that projects an organization’s expected revenues and expenses for a specific period, usually a month, quarter, or year. It constitutes a roadmap for how a business will allocate its resources to attain its financial objectives.
- Key Components of Operating Budget:
- Revenue
This encompasses all the income generated from a firm’s daily operations, for example sales of goods or services.
- Expenses
This includes all costs associated with operating the business, encompassing:
- Cost of Goods Sold (COGS):Direct costs associated with producing goods or providing services.
- Operating Expenses:Indirect costs, such as rent, utilities, salaries, marketing, and administrative costs.
Steps in Preparing an Operating Budget:
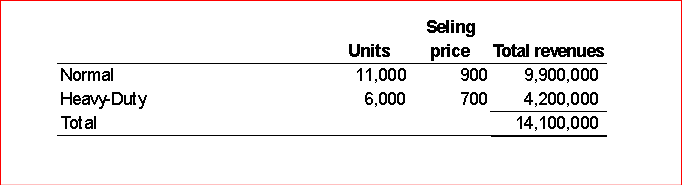
Step1: Revenue Budget for the year ending 31 December 2020
Step 2: Production budget [in units]
After revenues are budgeted, the production budget can be prepared. The total finished goods units to be produced depends on planned sales and expected changes in stock levels.

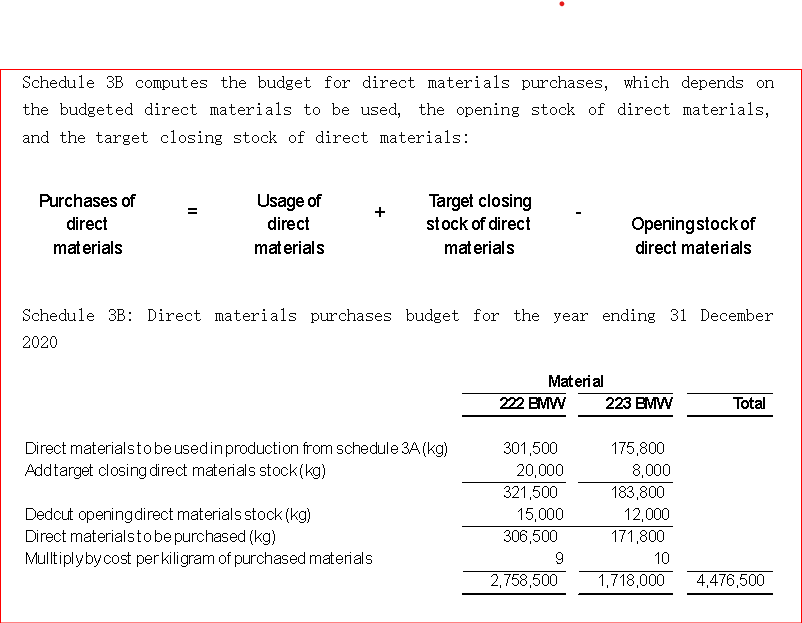
Step 3: Direct materials usage budget and direct materials purchases budget
Schedule 3A: Direct materials usage budget in kilograms and pounds for the year ending 31 December 2020
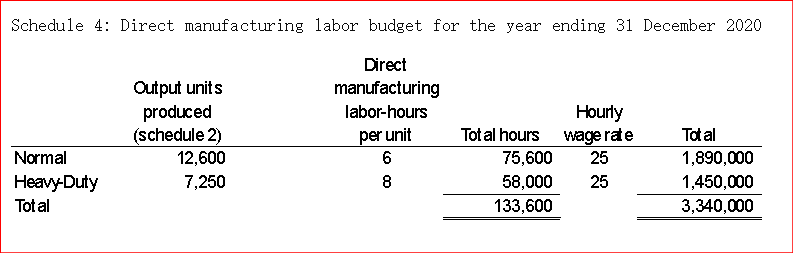
Step 4: Direct manufacturing labor budget.
These costs depend on wage rates, production methods and hiring plans.
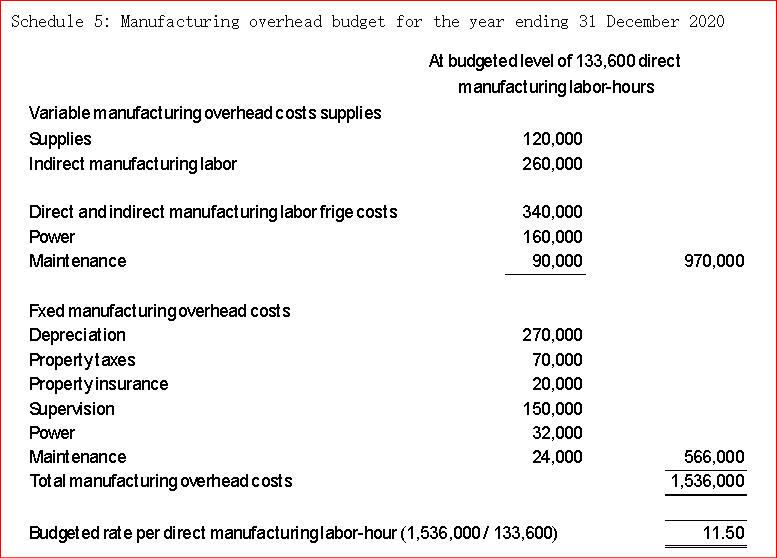
Step 5: Manufacturing overhead budget.
The total costs depend on how individual overheads costs vary with the assumed cost driver, direct manufacturing labor-hours. The specific variable-and fixed-cost categories may be obtained.
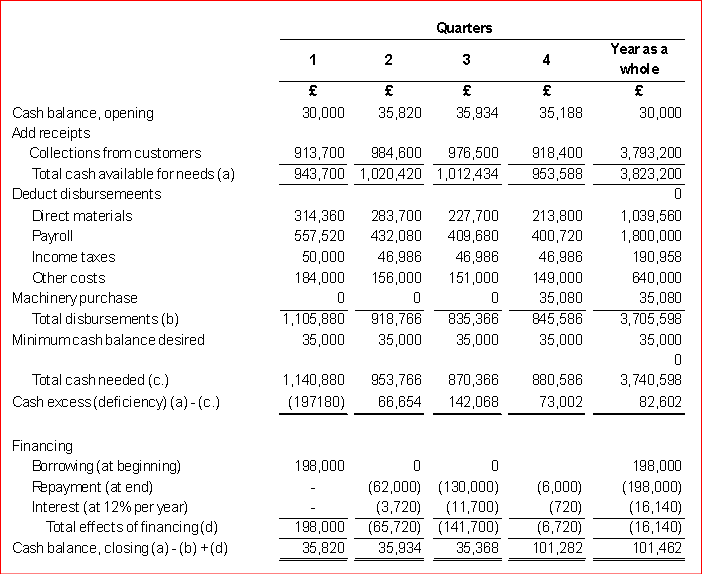
II. Cash Budget
A cash budget is a financial planning scheme that projects a business’ s cash inflows and outflows over a particular period, enabling it to manage liquidity and ensure adequate funds for operations. It forecasts cash availability, recognizes potential shortages, and helps with proactive planning for borrowing or other financial reconciliations or adjustments.
Key components and Benefits of Cash Budget:
- Cash Receipts:Encompasses all sources of cash flowing into a business, for example sales revenue, loan proceeds, and sales of assets.
- Cash Disbursements:Includes all cash flowing out of a business, such as operating expenses, capital expenditures, debt repayments, and owner’s withdrawals.
- Beginning and Ending Cash Balances:The cash balance at the start of the period (previous period’s ending balance) and the projected cash balance at the end of the period).
- Cash Excess or Shortfall: The difference between total cash inflows and outflows to ascertain if a business has a surplus or requires additional financing.
IV. Flexible Budget
A flexible budget represents a financial plan that adjusts on changes in levels of activities, for example production output or sales volume. Unlike static budget, which remains constant or fixed, a flexible budget adapts to consider variations in costs and revenues, revealing a more realistic picture of a company’s financial performance. This adaptability enables businesses to make informed decisions and effectively manage resources in dynamic environment.
- Variance and Benchmark
A variance is the difference between an actual result and a budgeted amount. The budgeted amount is the benchmark; it is the point of reference from which comparisons are made.
- Standard and Management by Exception
A standard is a prudently predetermined amount; it is often expressed on a per unit basis. There is a dividing line between a budgeted amount and standard amount. Management by exception is the practice of focusing on areas not operating as expected or foreseen, and giving less attention to areas operating is required.
- Favourable and Unfavourable Variances
A variance is favourable if its operating income increases relative to the budgeted standard. Unfavourable variance decreases relative to the budgeted standard.
Static-budgeted variance of operating profit = Actual results – Static-budgeted amount
Steps in Developing a Flexible Budget
Step 1: Determine the budgeted selling price unit, the budgeted variable costs per unit, and the budgeted fixed costs.
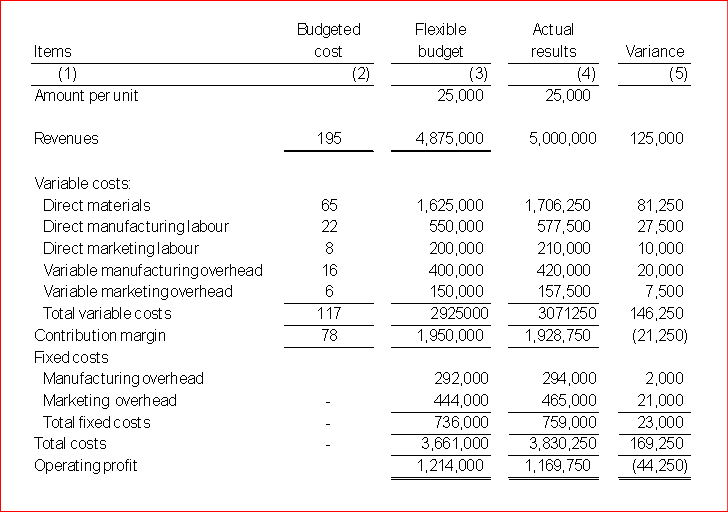
Step 2: Determine the actual quantity of the revenue driver. Dadin Co’s revenue driver is the number of units sold.
Step 3: Determine the flexible budget for revenue based on the budgeted unit revenue and the actual quantity of the revenue driver.
Flexible-budgeted revenues = £195 x 25,000
= £4,875,000
Step 4: Determine the actual quantity of the cost driver(s). Dadin Co’s cost driver for manufacturing costs is units produced. The cost driver for the marketing costs is units sold. Dadin Co produced and sold 25,000 shoes.
Step 5: Determine the flexible budget for costs based on the budgeted unit variable costs and fixed costs and the actual quantity of the cost driver(s).
Sales-Volume Variances
Flexible-budget Variances
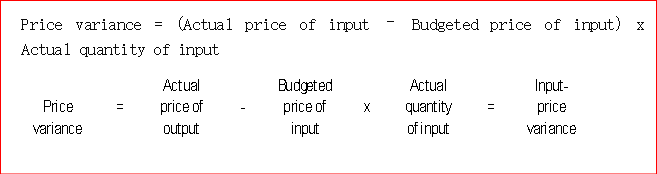
- Price Variance and Efficiency Variance
A price variance is the difference between the actual price and the budgeted price multiplied by the actual quantity of input in question (e.g., direct materials purchased or used). Price variances are sometimes referred to as input-price variance or rate variances (especially when variances are for direct labor). An efficiency variance is the difference between the actual quantity of input used and the budgeted quantity of input that should have been used, multiplied by the budgeted price. Efficiency variances are sometimes called input-efficiency variances or usage variances.