Comparable Companies Analysis
Comparable Companies Analysis (CCA)
Comparable company analysis is the process of comparing companies premised on analogous metrics to ascertain their enterprise value. A company’s valuation ratio ascertains whether it is undervalued or overvalued. CCA begins with establishing a peer group comprising of companies of equal companies of similar size in the same industry or region.
Comparable companies set out a market benchmark (using financial ratios and statistics) against which bankers can establish valuation for a private firm or analyze the value of a public company at a point in time. It has a wide range of applications, majorly for various M&A circumstances, Leveraged buyout, IPOs, restructurings, and investment decisions.
Updated 28 April, 2025.
Steps to Conduct Comparable Companies Analysis
1. Select the comparable peer group.
The characteristics for matching comparable companies are:
- Industry and sector: Operating in the same industry make sure companies encounter market dynamics alike.
- Size: Comparable companies tend to have similar revenue, market capitalization, assets, and number of employees.
- Growth and Profitability: Companies ought to have similar prospects of growth, operational drivers, and profit margins.
- Geography: Companies ought to opera in comparable locations (regions) with market conditions alike.
- Capital Structure: Similar leverage profiles (debt-to-equity) are significant, as capital structure impacts valuation.
2. Gather Financial Information. Collect core financial data for each firm in the peer group. This encompasses historical and projected numerical values for:
- Share price and market capitalization.
- Earnings per share.
- Revenue and Earnings Before Interest, Taxes, Depreciation, and Amortization (EBITDA).
- Enterprise value.
3. Collection of Statistics, Ratios, and Trade Multiples. Premised on the collected data, estimate significant valuation multiples for each firm in the peer group:
- Financial Statistics: Last twelve months (LTM), calendarization of financials, and adjustments for non-recurring items.
- Ratios and other Metrics: profitability, growth, returns ,and credit strength.
- EV/Sales: Company’s total value should be compared to its revenue.
- EV/EBITDA: Estimates total company value against operating cash flow, broadly used in financial analysis.
- P/E (Price-to-Earnings): shows the extent to which investors are keen to pay for each monetary value of a company’s earnings.
- P/B (Price-to-Book): Compares market value to book value, mostly used for financial firms.
4. Benchmarking Comparable Companies: This level requires profound examination of comparable companies to ascertain the target’s relative classification. Benchmarking helps ascertain relative strength of the comparable companies against one another and the target. The analogies and discrepancies in size, growth rates, margins, and leverage are among metrics closely examined.
Precedent Transaction Analysis
Precedent transaction analysis employs a multiple-based approach to evaluate an implied valuation range for a specific company, division, business, or collection of assets (target). It is based on multiples paid for companies before M&A transactions.
1. Precedent Transactions Analysis Steps:
- Select comparable acquisitions
- Find significant deal-related and financial information
- Elaborate key statistics, ratios, and transaction multiples
- Benchmark Comparable acquisitions
- Determine valuation
2. Select Comparable Acquisitions
The starting of assessing mergers and acquisitions is comparing previous transaction multiples. This means examining the history of M&A target and its comparable companies. The screening of M&A transaction size, form of consideration, period, among others.
Further M&A examination is market considerations which is referred to the business and economic environment, as well as current state of the capital markets, at the time of a particular transaction. These conditions directly influence availability and cost of acquisition financing and, thus, affect the price an acquirer is willing, or able, to pay.
3. Find Significant Deal-related Financial Information
Sourcing important deal-related data and target financial information for performing precedent transactions. These transactions are related to private and public targets, and if related information is available, it will be sufficient to determine purchase price and core target financial statistics.
4. Elaborate Key Statistics, Ratios, and Transaction Multiples
Elaborating each selected transaction entails broad assessment of core transaction information relating to purchase price, type of consideration, and target financial statistics of equity value (offer price) and enterprise value (transaction value) in precedent transactions.
- Offer Price per Share = Cash offer per Share + (Exchange Ratio x Acquirer’s Share Price)
- Equity Value = [Cash Offer per Share + (Exchange Ratio + Acquirer’s Share Price)] x Target’s Fully Diluted Share Outstanding
- Enterprise Value = Equity Value + Total Debt + Preferred Stock + Noncontrolling Interest – Cash and Cash Equivalents
5. Benchmark Comparable Acquisitions
Benchmark analysis is an approach used to compare companies to each other. It entails analyzing the performance of companies in identical sectors or industries and comparing the results. This entails an in-depth examination of selected comparable acquisitions to ascertain those most significant for valuing the target.
The most typical valuation measures used in comparable company analysis are enterprise value to sales (EV/S), price to earnings (P/E), price to book (P/B), and price to sales (P/S). If a company’s valuation ratio is higher than its peer average, the company is overvalued. If the valuation ratio is lower than its peer average, the company is undervalued.
6. Determine Valuation
In precedent transactions, the multiples of the selected comparable acquisitions are used to derive an implied valuation range for the target. While the standard varies by sector, the core multiples driving valuation in precedent transactions tend to enterprise value-to-LTM EBITDA and equity value-to-income.
Income Statement Model
Income statement model is significant for mergers and acquisitions valuation, because it shed light on a target company’s profitability, helps identify potential synergies (costs and revenue growth), as well as informs the pro forma financial statements. The historical income statements help acquirers to evaluate a target’s financial health, performance of future project, assess the potential impacts of a deal on the combined entity’s earnings, including determine its aggregate financial viability.


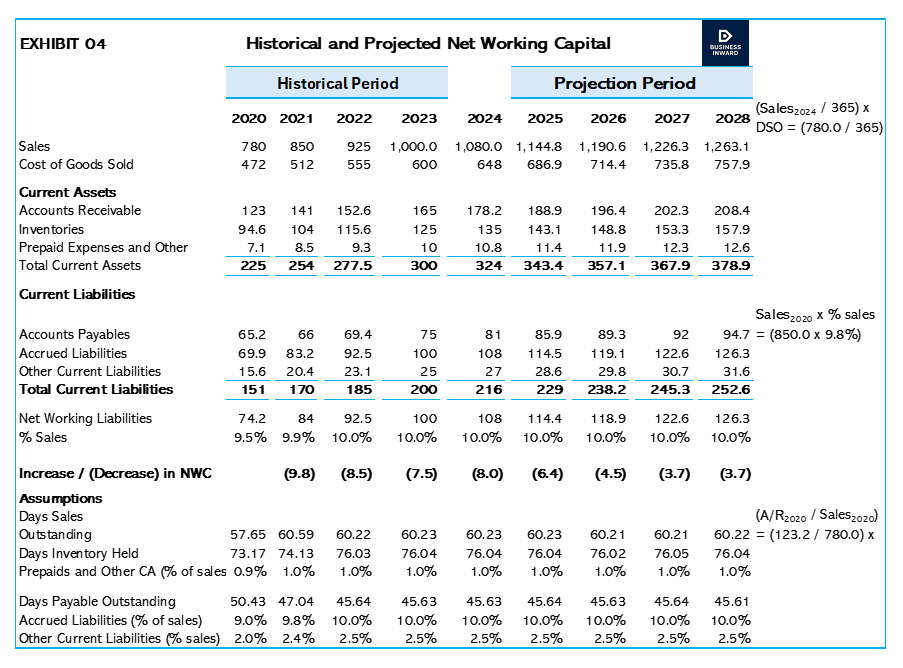
Projected Net working Capital
In M&A, projected net working capital represents an agreed-upon peg or target for the target entity’s normal operational liquidity at the closure of a deal. It is created during financial due diligence, with the acquiring company and seller negotiating the level, typically premised on historical data.
Weighted Cost of Capital Calculation
The weighted average cost capital (WACC) serves as an important discount rate and hurdle rate to assess the financial robustness of a deal and ascertain the target firm’s intrinsic value. The after-tax cost of equity and debt, weighted by their market proportions, is required for a firm evaluate if its projected returns from an acquisition outweigh its own cost of funding.


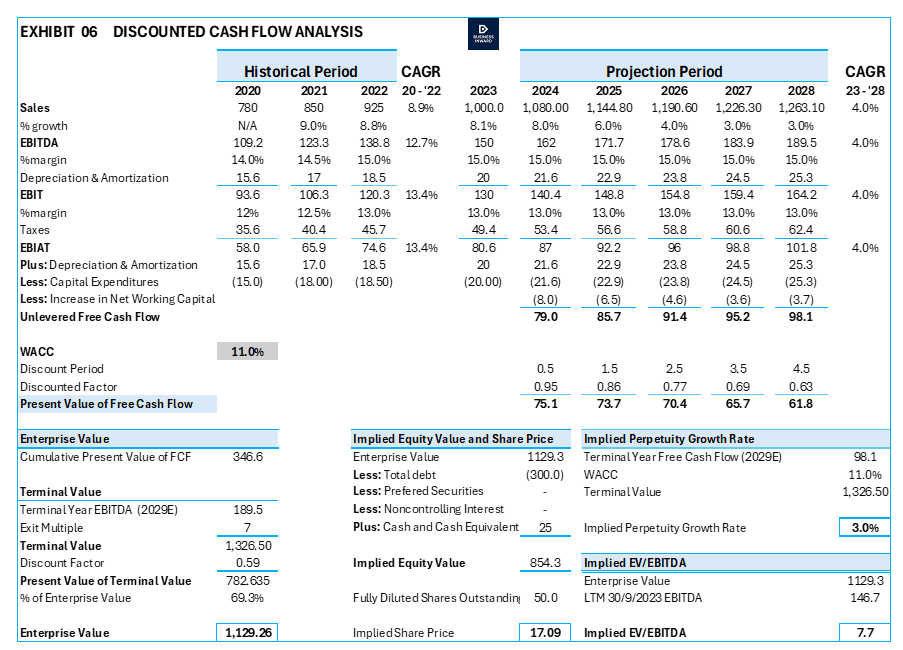
Discounted Cash Flow Analysis
The discounted cash flow (DCF) analysis is based on the principle that the value of a company, division, business, or collection of assets (target) can be derived from the present value of its projected free cash flow (FCF). A company’s projected FCF is derived from variety of assumptions and judgements about its expected financial performance, such as sales growth rates, profit margins, capital expenditures, and net working capital (NWC) requisites.
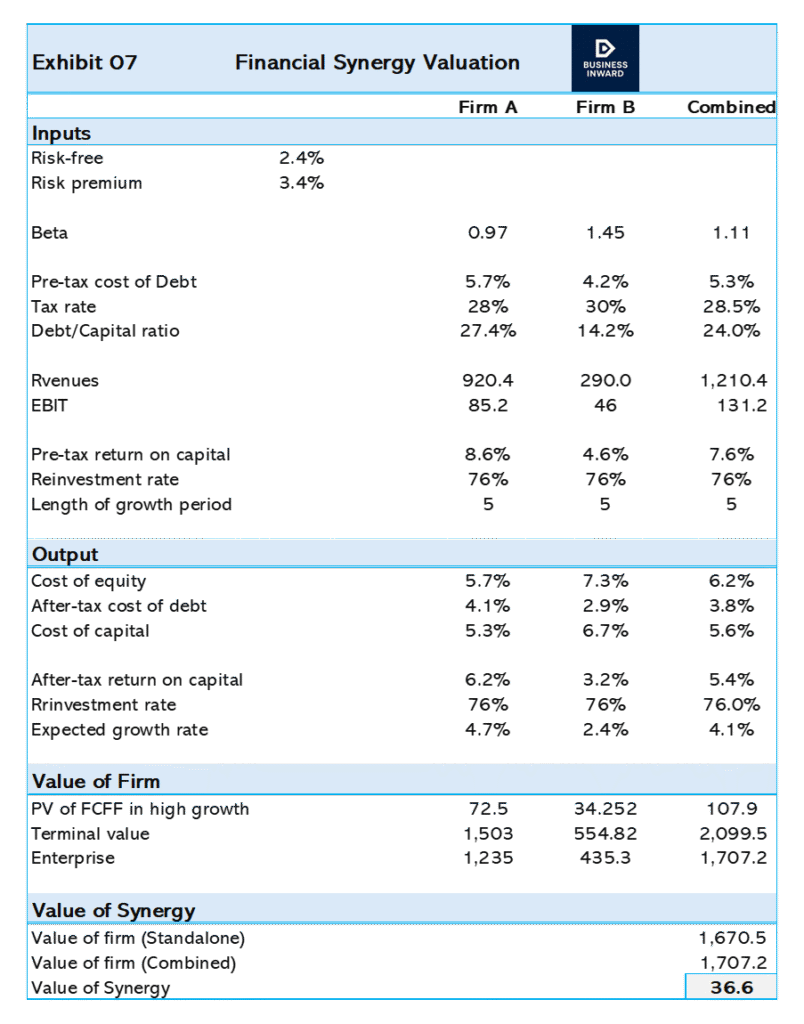
Financial Synergy Valuation
Financial synergy model impacts mergers and acquisitions by creating a framework to compute potential benefits, such as cost of capital, tax savings, and enhanced cash flow from combining two companies, which are significant for ascertaining value of deal, justification of acquisition premium, and maximizing shareholder value in the long run. The key characteristics encompass lower debt costs form risen collateral, tax benefits from combined losses or depreciation, and improved management of cash flow for in new projects.
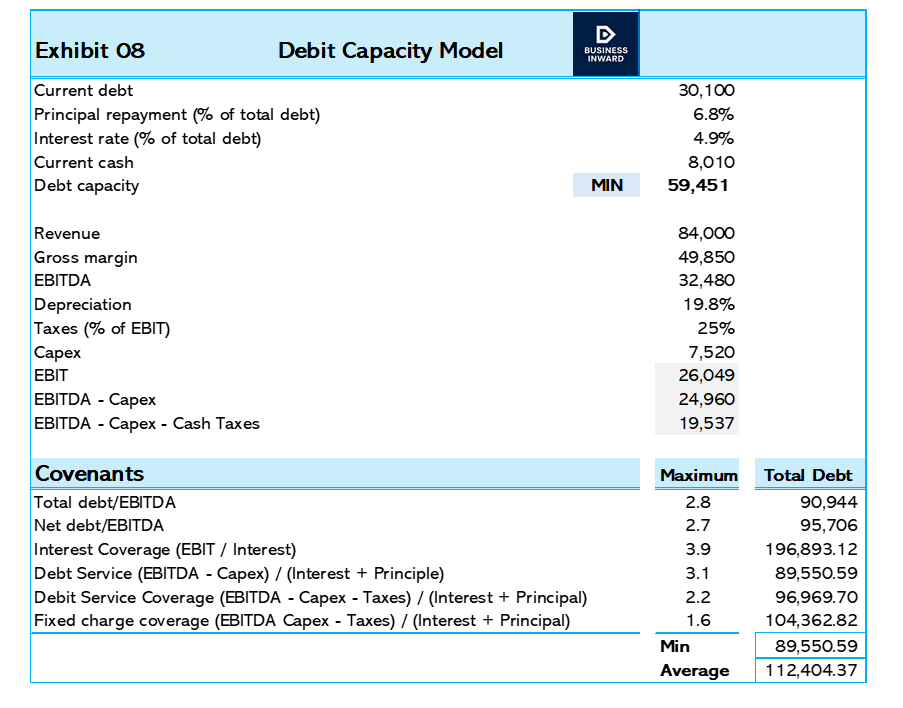
Debt Capacity Model
A debt capacity model constitutes a financial mechanism used to ascertain the maximum amount of debt a firm can sustain without putting at risk its financial health. This model evaluates a firm’s ability to service its debt obligation by analyzing its projection of its cash flow statements and financial metrics of balance sheet.